 by
by Marvel Crisis Protocol is a rich game that offers several approaches. You can choose to “control” a character to stop them from scoring, overwhelm them with conditions to reduce their impact on the table, or simply try to deal as much damage as possible to eliminate them quickly. Although most games are a clever mix of these approaches, some affiliations excel in only one of these three areas. In this article, we’ll focus on attrition and the statistical workings of the dice that underpin it.
Preamble: the D6
The iconic die is the six-sided die, with each face numbered from 1 to 6. The advantage is that the probability of any single roll on a six-sided die is quite easy to visualise. You have a one-in-six chance of rolling each value every time you throw the die.
The Gaussian curve
Beyond single-die rolls, other situations tend to resemble a normal distribution. From there, you simply multiply the average value of a die, 3.5, by the number of dice, and you can easily visualise the Gaussian curve taking shape on either side of that value.
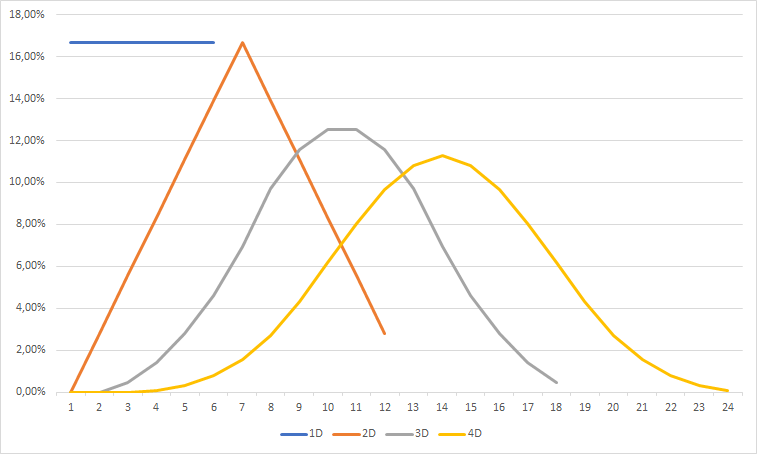
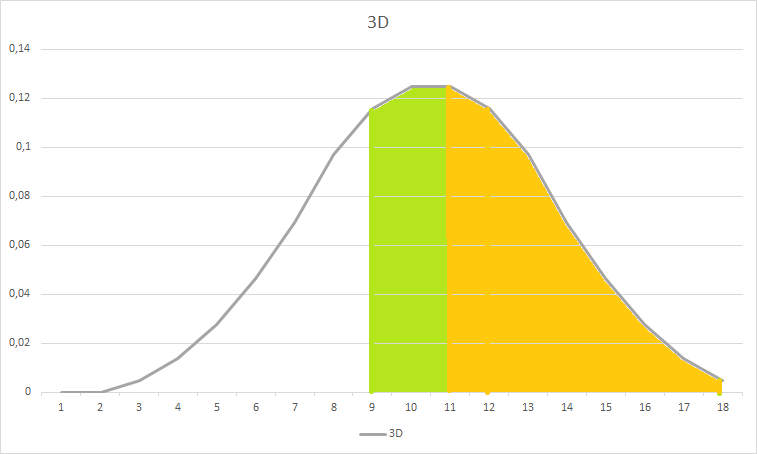
Generally speaking, in the context of a wargame, the value that interests us is the probability of rolling at least a given number. In that case, the probability corresponds to the area under the Gaussian curve beyond the target value. This remains fairly intuitive to visualise. For example, with 3 dice, we know the possible results range from 3 to 18, with an average of 10.5. With this information, we can picture the curve in our heads. This helps us realise that it is much easier to roll 9+ than 11+ with 3 dice. While the two values seem close, the difference in probability is significant: 75% chance for 9+ versus 50% for 11+ — a gap of 25%! Meanwhile, the difference between 5+ (98%) and 7+ (91%) is much smaller: only 6%.
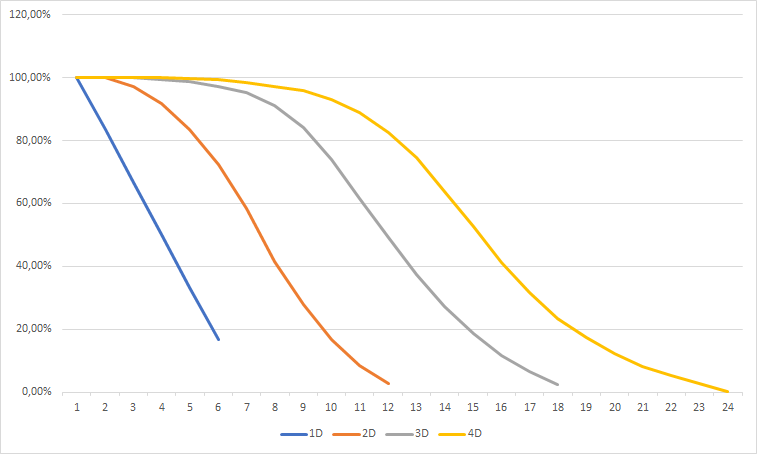
The cumulative distribution function
If our goal is to visualise the probabilities of rolling at least a certain value, we can also display our curves using the cumulative distribution function. While this simplifies the rest of the demonstration, it must be said that it is a bit harder to picture mentally.
The MCP dice system

To begin with, the Marvel Crisis Protocol die is a D8, not a D6. But the main difference is that the die is not numbered. Each face shows a symbol that can be treated as a “success” (1) or a “failure” (0), similar to a coin flip. Note that the faces considered as successes differ depending on whether you’re rolling for attack or defense.
The die contains:
- 2 “hit” faces
- 2 “blank” faces
- 1 “shield” face
- 1 “crit” face
- 1 “skull” face
- 1 “wild” face
For the rest of this demonstration, we will consider only attack rolls. In this case, only the Hit, Crit, and Wild faces count as successes. This makes a total of 4 “success” faces out of 8. You therefore have a one-in-two chance to roll a 1 and the same chance to roll a 0, giving an average result of 0.5 per die. Despite this difference, the distribution still resembles a fairly “normal” one.

Note that the minimum value of a die is “zero”, not “one” like on a D6. This means the system does not guarantee a minimum number of successes, no matter how many dice you roll!
Criticals
The subtlety of the MCP dice system lies in the fact that the faces have different in-game effects. We won’t go into the details of each face here. However, we will take critical results into account. In MCP, a critical “explodes”: when you roll a crit, you generate an additional die to roll. In this game, each crit explodes only once — meaning that dice generated by a crit do not explode again even if they show another crit. This rule significantly alters the probability curves.

This critical result is the first element that complicates our statistics. First, our curves are no longer true bell curves. But more importantly, the average damage per die in a standard roll is no longer 0.5, but rather around 0.6. Our curve, which only vaguely resembles a Gaussian curve, still keeps its visual peak in the same place: for example, with 6 dice, the “peak” still appears to be at 3, even though the actual average damage sits closer to 3.4. It may seem like a marginal “error” when doing quick calculations, but this flaw compounds significantly when you start rolling many dice and/or applying modifiers.
The reliability tools
There are many reliability tools in the game, each affecting the initial dice roll differently. I’ve selected a few of them for the purpose of this article.
- The ability to count skulls as crits, which adds one success face and also increases the chance to generate extra dice.
- The ability to count blanks as successes, which adds 2 success faces!
- The ability to reroll all dice that are not successes — what we’ll call the “any reroll”. Note that skull results can never be rerolled.
The probability of achieving at least a certain number of successes with the different reliability tools, using 6 dice.

The Cabal and its reliability tools
The Cabal is not the most optimized affiliation in the current meta. However, it remains the best one to explore if you want to understand reliability tools and their statistics:
Malekith
Malekith is one of the most powerful characters in the game. Some will say he doesn’t deserve his 7 threat, but there’s no denying that he hits extremely hard. He has the ability to count all his “skull” results as “crit“. For our demonstration, we’ll look at his basic attack (7 dice) and assume he always has the power required to use this ability.
Red Skull 2 (Master of Hydra)
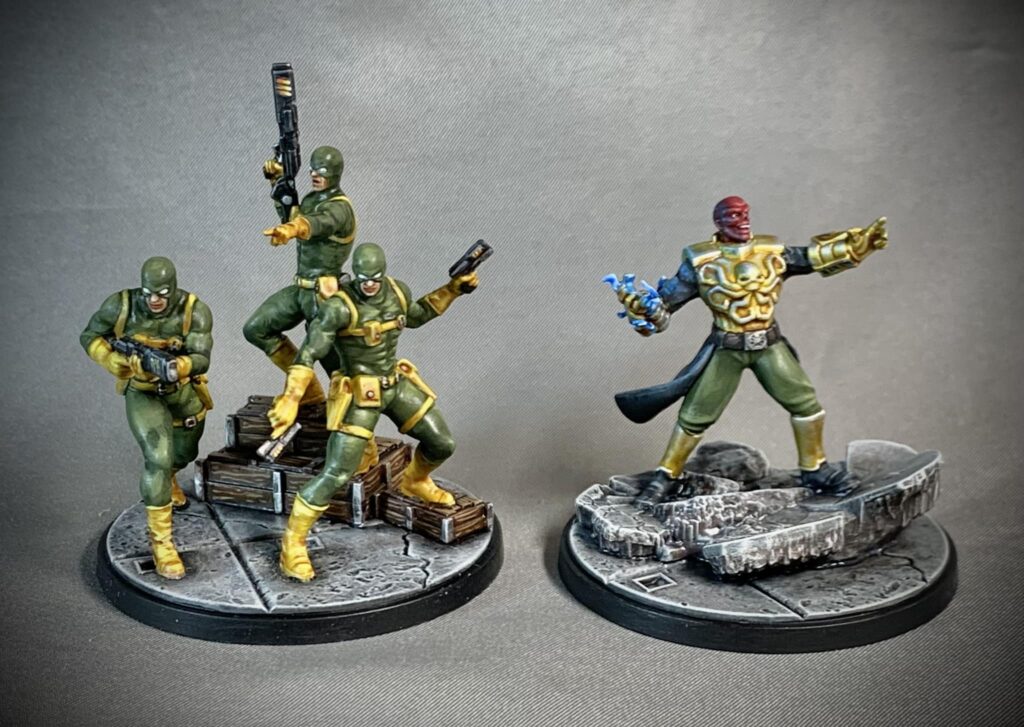
He has an ability that lets him count his “blanks” as successes on his basic attack (6 dice). For our example, we’ll assume he always has the power required to use this ability.
Zemo 1

He has a passive ability that allows him, and nearby allies, to reroll one die. On top of that, he also has an ability that lets him reroll as many dice as he wants on an attack. For the following examples, we’ll therefore consider his basic attack (5 dice) and assume he always has the power required to use this ability.
In this example, as a reference, we’ll compare our curves with attacks without modifiers, also called “flat” attacks. I chose a fairly standard attack for high-threat characters: 7 dice. I also added She-Hulk, because she remains one of the characters capable of rolling the most dice. Here she’ll roll 9 dice.

The result is clear: rolling a lot of dice is not a guarantee of success. Zemo, with his 5-dice “any reroll + reroll” setup, outperforms 7 flat dice. Malekith, who “only” rolls 7 dice, performs better than 9 dice! And RS2 with 6 dice comes surprisingly close!
The average damage on 7 dice is 3.95, whereas Zemo’s average damage is “only” 4.15. When trying to intuit statistics, the difference between these values feels negligible. One might be tempted to conclude that the two attacks are equivalent. And indeed, 7 dice allow you to hit spikes of 9 or 10 damage (which increases the average damage). Yet the curves show that it is noticeably “easier” to deal 4 damage with Zemo than with 7 unmodified dice.
Zemo’s reroll
As mentioned earlier, Zemo benefits from a native reroll, and he also grants that reroll to nearby allies. This is a good opportunity to see the impact of a simple reroll on a die roll. (Remember: skulls can never be rerolled.)

We can see that Malekith makes great use of this reroll — which makes sense for models generating lots of dice. There will be very few situations where Malekith has nothing to reroll. In contrast, Red Skull benefits far less from this reroll. This is even more true when the initial roll is good. This is because Red Skull only rerolls “shields”, meaning that in any roll where he doesn’t get a shield (one face out of eight), the reroll is useless. And even then, in practice, you often prefer not to reroll them since they matter for his attack effects.
Dark Reign
Dark Reign remains “THE” interesting Cabal card. It allows all Cabal characters to reroll as many dice as they want (any reroll) against the targeted enemy. However, the extra damage this card enables will only occasionally benefit more than one of your characters. Understanding the probabilities is therefore a good way to know when and how to use this card to maximise its impact.

What’s interesting is that we can see Zemo benefits only moderately from this card. Indeed, in our example he will already have used several rerolls. Chances are he will have very few dice left to reroll. For Red Skull, the curve is roughly the same whether using a single reroll or any reroll. Malekith, however, significantly increases his reliability on minimum damage without sacrificing the rest of the curve.
Baron Mordo
One way to “reliabilize” an action can also be by adding dice. The Cabal offers this option with Baron Mordo. He has an ability that allows him to add 2 dice to a nearby ally. Again, Baron Mordo has a limited power generation. It can therefore be useful to know the associated statistics to make the best use of this ability.

Unlike rerolls, extra dice allow for more “spikes”, meaning more crits and therefore more successes. Unsurprisingly, Malekith makes very good use of this mechanic with an average damage of 7.25. However, it is still RS2 and Zemo who optimize this ability best. Their strong reliability mechanics allow them to efficiently convert the 2 extra dice into damage.
Need advice building your roster?
Join your country’s MCP Discord community and get answers to your questions.
Why “reliabilize” your attacks?
So far we’ve intentionally “ignored” half the problem. We have set aside the defense roll. For example, let’s consider a somewhat “tanky” opponent. In this case, it’s reasonable to set the opponent’s number of defenses at 3 successes. Our “Kaiju” rolling 7 flat dice would still have a 20% chance to deal zero damage! Zemo, with all his rerolls, improves this stat and has a 90% chance of dealing at least 1 damage. Under Dark Reign, he not only has the same probability as a 7-dice attack to deal high damage (above 7) but is almost guaranteed to deal at least 1 damage!

In conclusion…
I admit that, in broad terms, this article might seem like it’s stating the obvious. But seeing the questionable strategic choices I observe in games, or the exasperated reactions of some players to dice rolls, I think not everyone has a clear vision of what to expect from their dice. Beyond the average damage, one must keep in mind the distribution around that average: the shape of the curves. Modeling the curves in this way can therefore be useful.
For example, while everyone may intuitively understand the stat of a 7-dice attack, it’s less obvious that Malekith with his reliability booster has statistics close to a 9-dice attack! Similarly, while the value of rerolls in this game is understood, it is less obvious that Red Skull will benefit very little from them.

In green, the character’s roll with their reliability boosters; in purple, Zemo’s reroll; in black, Dark Reign; in orange, Baron Mordo’s 2 dice.
This study helped me better align my expectations with my characters’ actual capabilities. It allowed me to understand why I felt so much frustration playing She-Hulk, for example. It now enables me to make more reasonable choices during games and optimize the use of my reliability boosters. I hope it will help you gain clearer insight as well.
Written by :

Starpu, Marvel Crisis Protocol editor
A competitive player at heart, I cut my teeth on Warhammer 40,000, but it was Warmachine that truly launched me into the competitive scene. After a stint with Infinity N4, today Marvel Crisis Protocol excites me the most, especially for its rich tournament play.
Explore our coverage by game


Support us via Maxi Rêves ✨
Help us promote lesser-known miniature games and grow their communities. Order your miniatures from Maxi Rêves using the code MAXITC and be part of our mission!